Data Science main areas
Mathematics
Mathematics is fundamental to a Data Scientist, Why? Isn´t the computer going to do all the maths for us? The answer is yes, but you must know about maths to tell the computer what operations to do and besides that you will need to interpret lots of results. We learn several fields of maths, as Linear Algebra, Optimization, Calculus.
Statistics
In this area, you will be going to use several statistical concepts (Hypothesis tests, inferential statistics, confidence intervals, …) and mathematics (Linear Algebra, Optimization, Discrete Mathematics, …) to interpret the results you might generate through data analysis.
Computer Science
It is one of the main areas of knowledge used in Data Science. Therefore, it is extremely important that data scientists invest part of their time in developing this hard skill.
What is Data Science?
Data science is multidisciplinary subject that has one goal, which is to extract knowledge from data, and use that knowledge to improve something. Let us give you two examples:
1. Imagine you are a Data Scientist working for a company and you have access to all the past year's sales records. The company wants a better sales model, so your job could be to find patterns in sales. After you have gathered a lot of information you could create a sales model and predict how much of income your company would get, or in other words, how much profit.
2. In this example you are now a Data Scientist working for the National Health Program. You have access to a dataset that contains information about people's habits and way of life, such as food, sports or sleeping habits. In addition, the dataset contains information relative to the person's health condition. What could you do with this? You could try to find patterns between people's way of life and their health conditions. After your analysis and modeling you got the pattern that as a greater chance of not having diseases, that my friends is knowledge.
Data Science, as the two examples shown, can be applied to many realities. For that you need to have skills in programming, mathematics, statistics and business understanding, to be able to correctly interpret the data.
The work cycle of a Data Scientist
1. Business understanding
In order to do Data Science about a determined business, you must study about that business. Otherwise, your conclusions will not be of any use. You can study using the internet or talking with people that understand the business. So, for that matter a Data Scientist should be a fast learner and have a lot of general knowledge.
2. Data preparation
Process of selecting, cleaning, and transforming raw data before processing and analysis of data. This step can pass by correcting mistakes on data, deleting data that does not have enough quality or transform variables, like transform words into numbers. This process is done using software, like Excel.
3. Data analysis
Data analysis is a process of modeling data with the goal of discovering useful information. During this phase we extract simple information about data, like the average of a set of values, for example calculate the average height of 20 people. After gathering a lot of measures (average, median, maximum, minimum, etc) about the data, we have at our disposal the requirements to continue to the next step.
4. Data modeling
Data modeling it is based on manipulating data using modeling techniques. In this process you will select the modeling technique that fits the best in this case. Then you will use machine learning techniques in order to apply the modeling technique chosen. Machine learning consists in using algorithms to extract data, learn from it, and then forecast future trends for the topic that you are analyzing.
5. Drawing conclusion
After all this processes you will achieve some results that need to be evaluated. Then when you realize that the results are correct you will approve the models used in the previous step and forecast the next steps that need to be approved. At the end you need to apply this conclusion to business in order to produce the final report that you are going to present to the company/organization
Note: The importance of data science it’s been growing in the last few years and it will, certainly, grow even more. This big evolution in the amount of data has forced, every industry, big or small, to evolve if they want to remain competitive in the age of big data. So, this new era we are living created a need to efficiently develop and implement data science, or risk being left behind in the market.
Big Data
Big Data is a field of study that deals with analyzing and obtaining information from datasets that are too large to be analyzed by traditional systems. Big Data is becoming more popular because of the exponential increase in the data that is generated every day.
These data can be structured having some pattern or format that can be used in their reading and extraction of data. Structured data can be found on relational databases, legacy systems, text files (like csv, txt or XML). Data can also be unstructured and have no standardized format for reading, they can be Word files, Internet pages, videos, audios, among others, that are generated every second, all around the globe. Big Data is defined by its 3 V's:
1. Volume: increasing the amount of data;
2. Variety: Structured data, spreadsheets, photos, videos, natural text, etc…
3. Velocity: Real-time analysis requires data to be used as quickly as it is generated
Machine Learning
Machine learning is a field of computer science that focus in the study of algorithms to predict variables. These algorithms build models based on data, usually called the sample data or training set. The word learning is very important, since the models improve their performance when the amount of input data is greater, they learn from it. ML algorithms use computational statistics and mathematical optimization. Machine learning employs two main groups:
Supervised learning involves training a model based on labeled data in order to make predictions. If you need to train a model to make a forecast of a continuous variable, such as a temperature, or a categorical variable, such as spam classification, supervised learning is the best solution.
Unsupervised learning, which involves uncovering hidden patterns or inherent structures in input data. Unsupervised learning it's used to make inferences from datasets that don't have any labeled data. The most used unsupervised learning approach is clustering. It's used in exploratory data analysis to uncover hidden patterns or groupings.
Linear Regression
Linear regression is a supervised method, used to predict continuous variables, such as prices or weights. To apply this model, you will need to study the relationship between the target variable and the features. To do that the Pearson correlation coefficient can be used. If two variables present a high value for this coefficient it means that a Linear Regression could be a good solution to apply to the data. Linear regression allows two or more features, bellow there is an example with two variables , the dependent variable Y and the independent variable X.
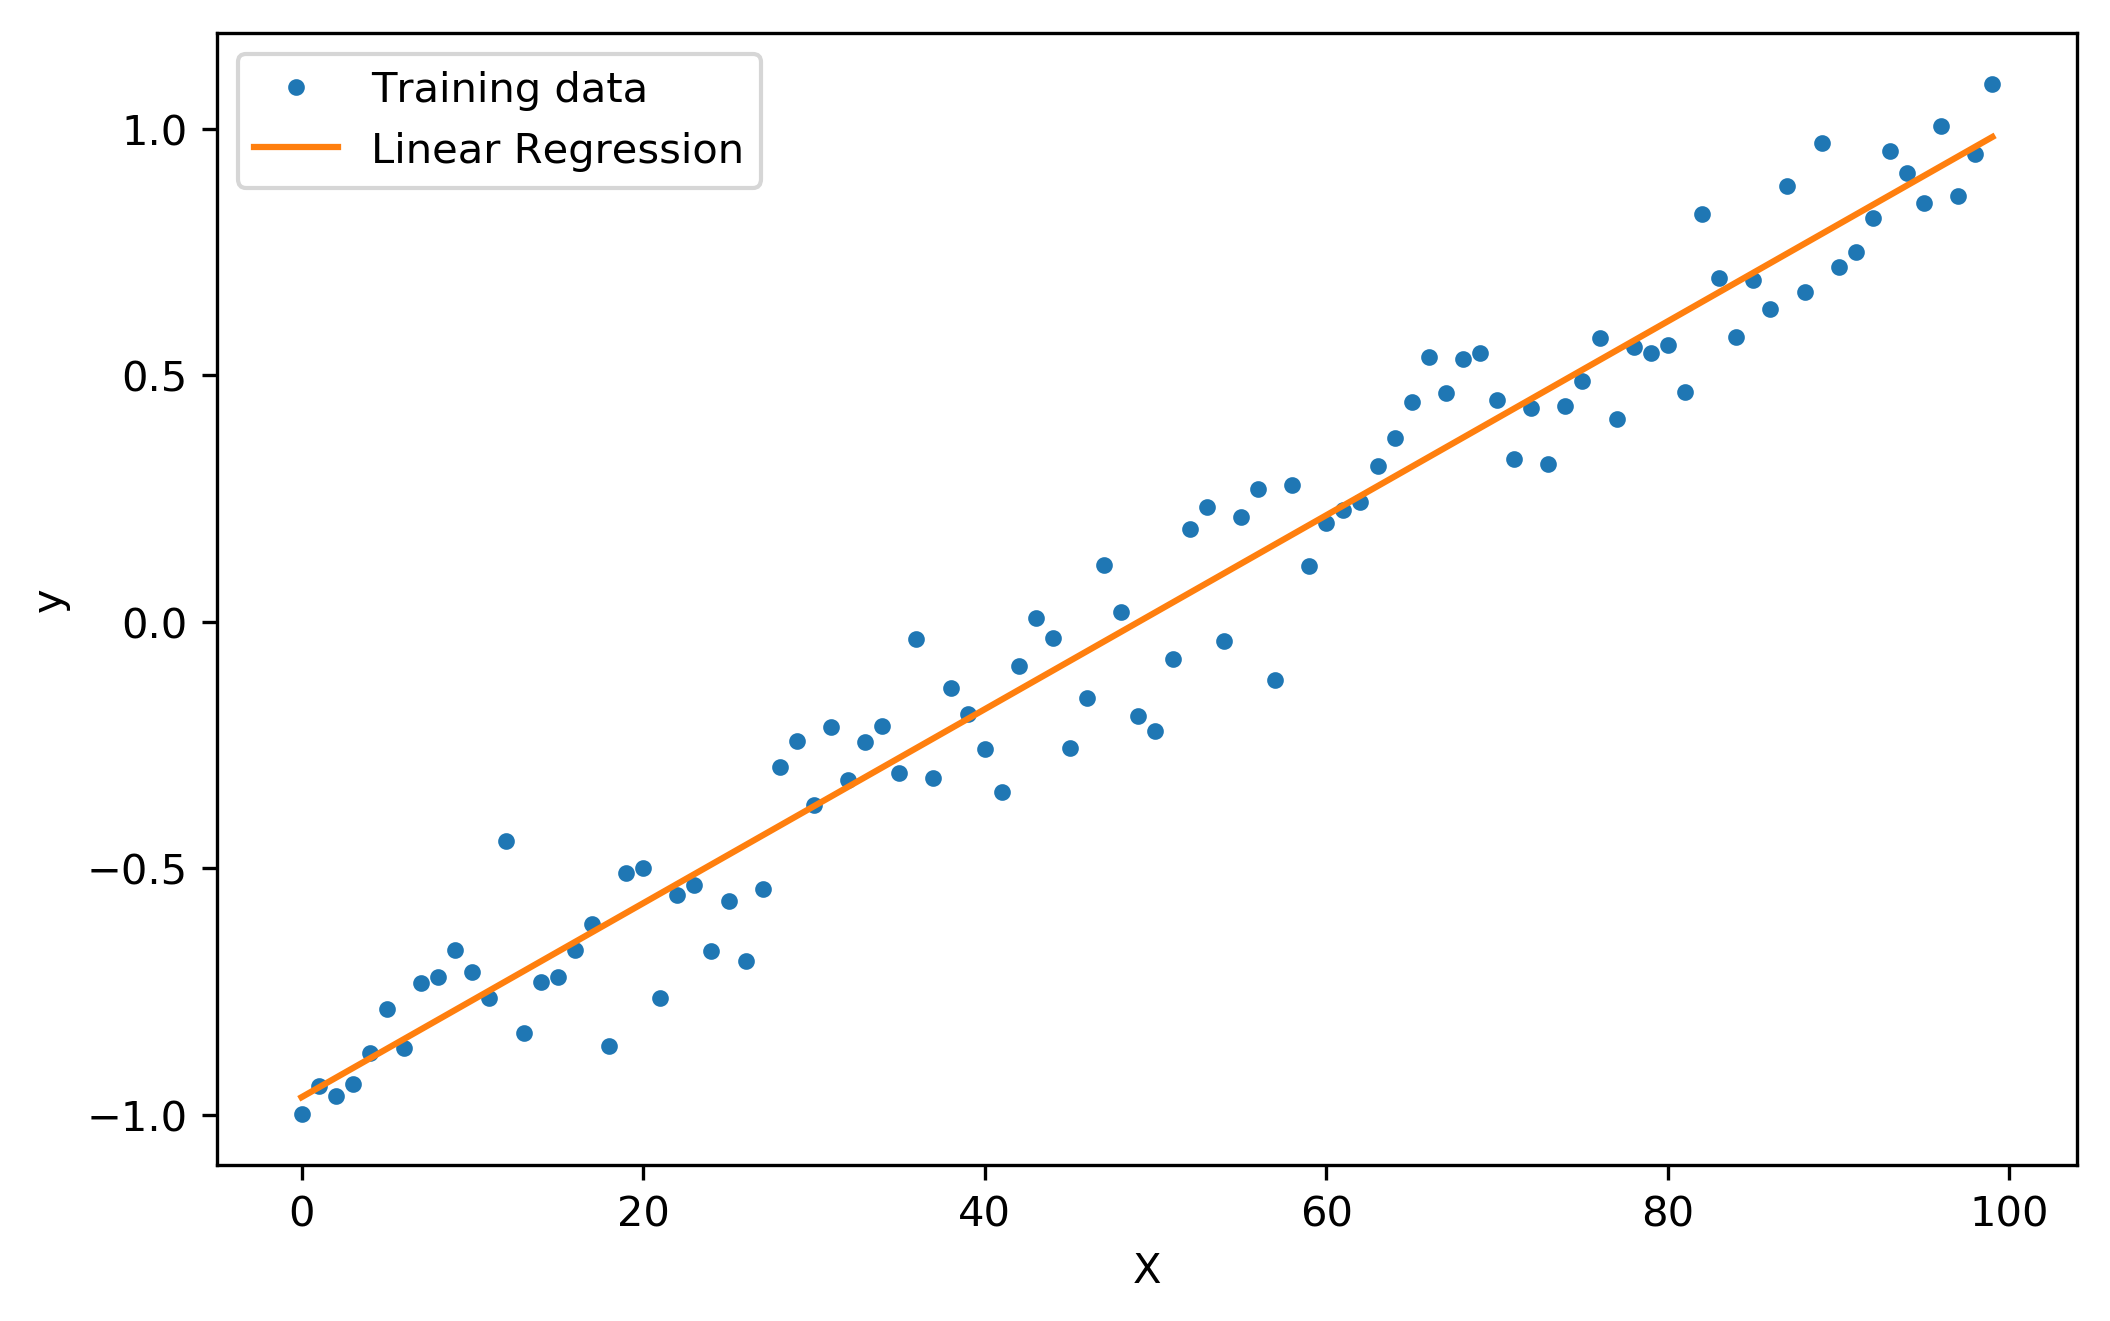
As you can see the line does not fit the data points perfectly but approaches them in the best linear way. The main goal of this algorithm is to find the regression line that minimizes the prediction error, which is the gap between real and predicted data. To find the prediction error of the model in the image above, you just need to sum the vertical distances between the data points and the regression line. This model is one of the simplest machine learning parametric models but can be applied to many problems and return good predictions.
Naïve Bayes
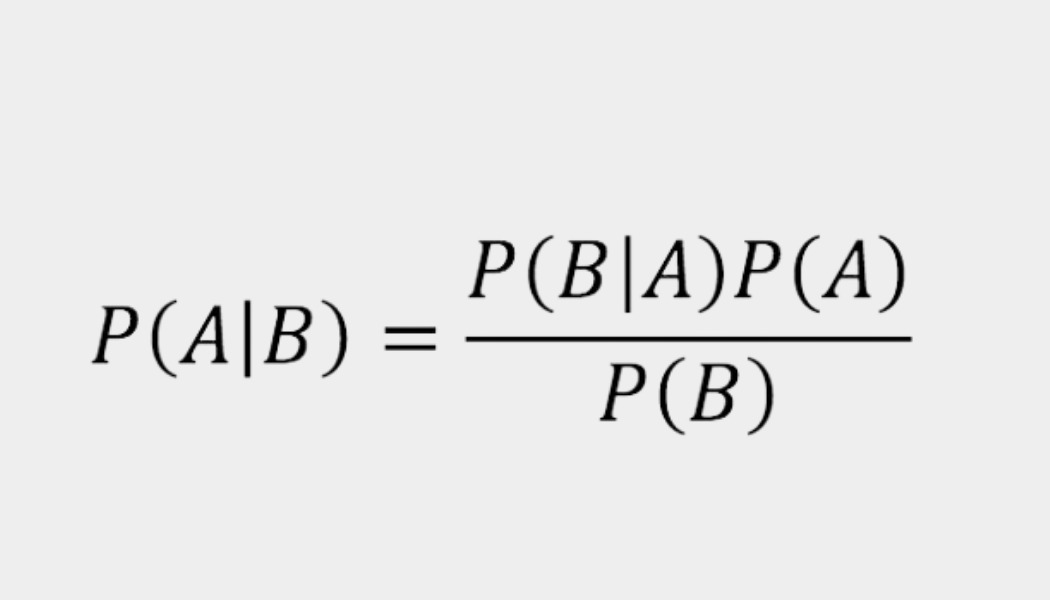
Naïve bayes is a supervised machine learning algorithm used to solve classification problems. This algorithm, as the name already anticipates, is based on a probabilistic theorem related to conditional probabilities, called Bayes Theorem (image below). To apply this model to your data you must verify that the features in use are independent, otherwise the prediction results are not going to be good.
Imagine the following classification problem: determine whether an individual has diabetes or not. In this case the target variable is binary, sice it has only two possible outcomes. To create your predictions, you have at your disposal several features, such as the age of the individual, the Body Mass Index, insulin, glucose, and blood pressure levels. The algorithm will evaluate the probability of the outcomes, given each one of the features. Given new data points the algorithm is going to use those probabilities to classify the target variable, or in other words, predict whether the individuals in study have diabetes or not.